What is Fundamental Analysis?
Crypto fundamental analysis is a method used to determine the “intrinsic value” or “real value” of a cryptocurrency. This involves evaluating various metrics to understand the underlying worth of an asset. Here, we examine factors such as active addresses, use cases, competition, and the development team. With the help of those factors, fundamental analysis helps investors decide if a cryptocurrency is undervalued or overvalued, guiding their trading or investment decisions.
Fundamental Analysis (FA) vs Technical Analysis (TA)
To effectively use fundamental analysis, it’s important to understand its counterpart, technical analysis (TA). Here are the core differences:
- Technical Analysis (TA): Focuses on predicting market movements, sentiments, and trends using quantitative/statistical data like current market price, trading volume, and historical data. It’s all about pure numbers.
- Fundamental Analysis (FA): Concentrates on the underlying factors driving price changes, such as project fundamentals, market demand, and external influences. It’s all about fundamentals.
Both TA and FA offer valuable insights, and successful trading strategies must incorporate both to understand market trends from multiple perspectives.
Fundamental Analysis Metrics
On-Chain Metrics:
- Transaction Value: The number and total value of transactions in a specific period. This indicates network activity and speed, measured in transactions per second (TPS). However, smaller networks may trick us by inflating activity, with self-transactions.
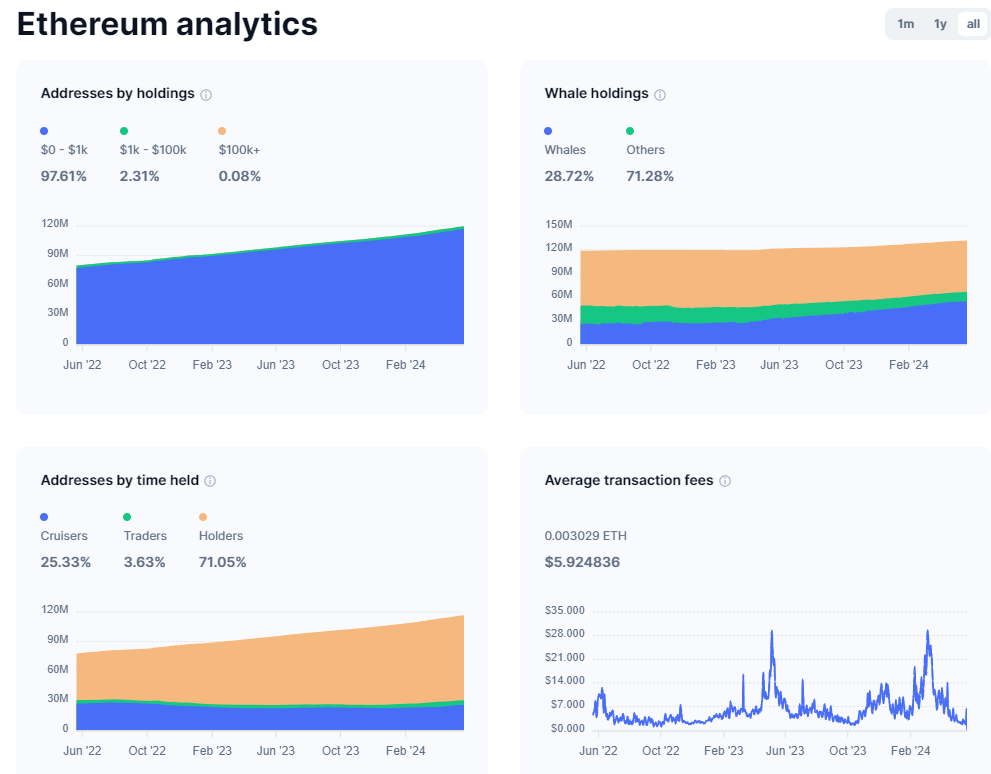
- Active Addresses: Counting the total unique senders and receivers within a time frame reveals how many people are using the network.
- Transaction Fees: Analyzing fees paid for transactions provides insight into the economic relationship between transaction senders and miners. If fees are too high there will be few users, but if fees are too low there will be few miners.
- Consensus Metrics: Consensus methods indicate how a blockchain is secured and how network participants agree on the current state of the blockchain. 2 main categories are Proof of Work and Proof of Stake.
- Hash Rate (PoW): Represents the total computing power used to mine a blockchain, indicating network security and miner interest.
- Staking Volume (PoS): Reflects the total amount of cryptocurrency staked, showing network interest and security, often referred to as total value locked (TVL).
One of the example of On chain analysis would be to analyze number of Bitcoin’s active addresses, by using Glassnode.com. Another example is Ethereum’s analytics, on Coinmarketcap.com
Project-Based Metrics:
- Documentation: Documentation includes lot of areas, but most important one is White paper. Good white paper provides information about underlying technology and the problems project is trying to solve. White paper must include: detailing technology, use cases, team, token distribution, and roadmap.
- Team and Community: Information on the project team and their background. Are they qualified to run the project? have they done something similar in past? What about community, how active are the investors? What’s the engagement level, and so on.
- Competitors and Use Cases: Analyzing competitors and the unique value proposition of the project. Every project has competitors, you need to know the USP (Unique selling point,) of the project. What makes them different from competitors?
- Tokenomics: Tokenomics are all about the distribution of cryptocurrency itself. How much was offered during launch, how much is in reserve for marketing, how much is in reserve for unlock? Unlocking schedule is key here. If tokens will be unlocked all at once, the price will dump.
Financial Metrics:
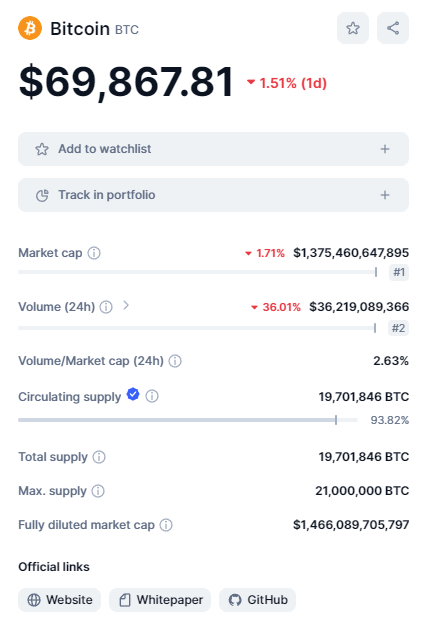
- Market Capitalization: Calculated by multiplying the current price by the total circulating supply. It represents the cumulative value of all units of a cryptocurrency.
- Liquidity and Trading Volume: Assessing how easily an asset can be bought or sold. High liquidity indicates ease of trading, and trading volume reflects market interest. Liquidity and Trading Volume are very close to each other, but it’s volume that causes liquidity and not the other way around.
- Supply: Includes maximum supply, circulating supply, and inflation/deflation rates. Some cryptocurrencies have a fixed supply (e.g., Bitcoin), while others may burn tokens to decrease supply. Circulating supply is all the coins in circulation.
Let’s take Bitcoin’s example, by going in Coinmarketcap.com Here you see all the necessary metrics: Market Cap, Volume, Circulating Supply, Total Supply, Max Supply.
Fundamental Analysis Indicators
Combining metrics can create powerful indicators. This goes for Technical analysis and also Fundamental Analysis:
- Network Value to Transactions Ratio (NVT): Compares market cap to transaction volume, similar to the P/E ratio in stocks. A high NVT indicates that the network value exceeds the actual value being transferred.
- Market Value to Realized Value Ratio (MVRV): Compares an asset’s market cap to its realized capitalization (market cap minus lost or inaccessible coins). It helps determine if the price is above or below “fair value,” useful for spotting market tops or bottoms.
- Stock-to-Flow Model: Based on the assumption that scarcity drives value. It views each cryptocurrency as a fixed, scarce resource. Bitcoin’s value has historically followed the S/F Ratio, making it a popular model for predicting future price movements.
Conclusion
Crypto fundamental analysis provides a deep understanding of a cryptocurrency’s intrinsic value by evaluating on-chain data, project fundamentals, and financial metrics. While TA predicts short-term market movements, FA uncovers the underlying factors driving those changes. Combining both approaches is necessary to enhance trading strategies and improve overall market comprehension.