Understanding the Crypto Fear and Greed Index
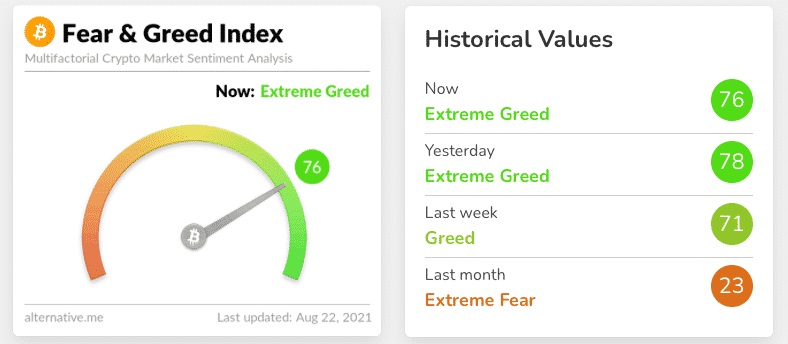
The Crypto Fear and Greed Index is a handy tool for gauging the overall mood in the cryptocurrency market. It compiles various data points into a single score from 0 to 100, indicating market sentiment ranging from extreme fear (0-24) to extreme greed (75-100). This index mainly focuses on Bitcoin data but reflects broader market trends.
How is the Crypto Fear and Greed Index Calculated?
The index draws from several sources:
- Volatility: High volatility often signals fear.
- Market Momentum/Volume: Increased momentum and volume can indicate greed.
- Public Sentiment Data: High levels of positive sentiment in social media and forums suggest greed, while negative sentiment points to fear.
- Dominance: Bitcoin’s dominance in the market can signal investor confidence or caution.
- Trends: Google Trends data shows how many people are searching for Bitcoin-related information, hinting at market interest and sentiment.
How to Use the Crypto Fear and Greed Index
Traders can use this index as an extra layer of data for making decisions. Here’s how:
- Extreme Fear: A score between 0 and 24 might indicate that the market is overly worried, potentially presenting a buying opportunity.
- Extreme Greed: A score between 75 and 100 might suggest that the market is overconfident, indicating a possible downturn ahead.
However, it’s crucial to use this index as a guide rather than a strict rule. It’s one tool among many for understanding market dynamics.
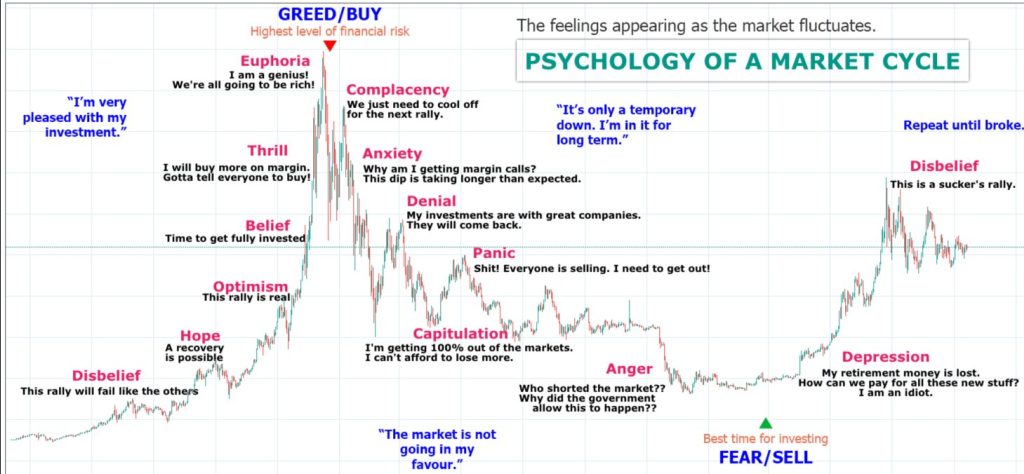
Insights from the Crypto Fear and Greed Index
By examining the historical chart of the index, traders can observe how market sentiment has shifted over time. This long-term view can help in understanding the emotional ebb and flow of the market, offering insights into periods of fear and greed and how they correlate with price movements.
Trading with Fear and Greed
While the Crypto Fear and Greed Index is primarily used as a daily indicator, it can provide valuable insights for both short-term and long-term strategies.
- Low Index Values: May imply that the market is undervalued, potentially signaling a good buying opportunity.
- High Index Values: Could suggest that the market is overheated, warning traders to be cautious of potential sell-offs.
The tool is on this link, make sure you use it alongside with other tools, as no one tool can be enough.