Technical analysis is like the X-ray vision of cryptocurrency trading – it helps you see beneath the surface and make smarter decisions. But don’t worry, it’s not as complicated as it sounds. This guide breaks down the basics of technical analysis, from what it is to the tools you need to master.
What is Technical Analysis?
What: In simple terms, technical analysis involves crunching data from crypto markets to predict future price movements. It’s about seeing the past patterns to predict the future.
Why: Technical analysis dives deep into an asset’s past and present prices to forecast where it’s headed next. It’s based on the idea that price changes aren’t random but follow distinct patterns and trends. So, by analyzing these trends, we can anticipate future market moves. Think of it as deciphering the language of the market.
Fundamentals of Technical Analysis
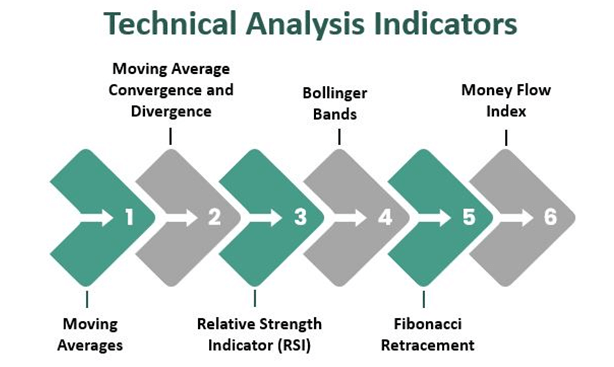
Technical indicators are the secret sauce of technical analysis. These tools help us spot trends and predict market movements. You’ve got your simple moving averages, relative strength index (RSI), and Bollinger Bands, just to name a few. They’re like your trusty sidekicks in the world of crypto trading.
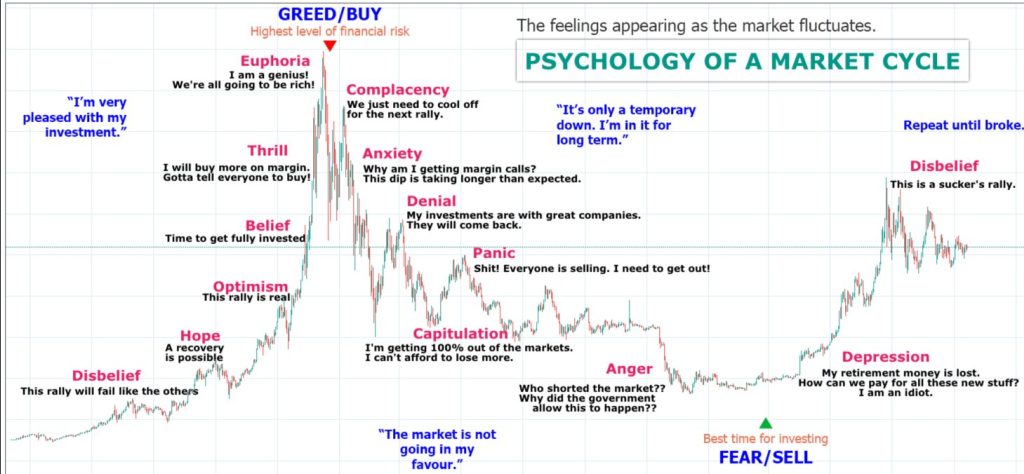
Market Cycles: Advanced traders also keep an eye on market cycles – long-term patterns that influence price movements. By understanding these cycles, traders can better anticipate market shifts and adjust their strategies accordingly. It’s like having a roadmap to navigate the twists and turns of the crypto landscape.
Technical vs. Fundamental Analysis: While technical analysis focuses on charts and patterns, fundamental analysis takes a broader view, considering qualitative factors like market sentiment and news events. It’s like comparing apples to oranges – both valuable in their own way.
Mastering the Basics
At its core, technical analysis is all about identifying trends. Whether it’s an upward surge, a downward spiral, or a sideways shuffle, trends give us insight into market behavior. By studying chart patterns and indicators, traders can spot trends and make informed decisions.
Chart Patterns
Chart patterns are like fingerprints – unique formations that reveal clues about an asset’s future movements. Indicators, on the other hand, are like maps, guiding us through the maze of market data. By mastering these tools, you’ll be well on your way to becoming a crypto trading pro.
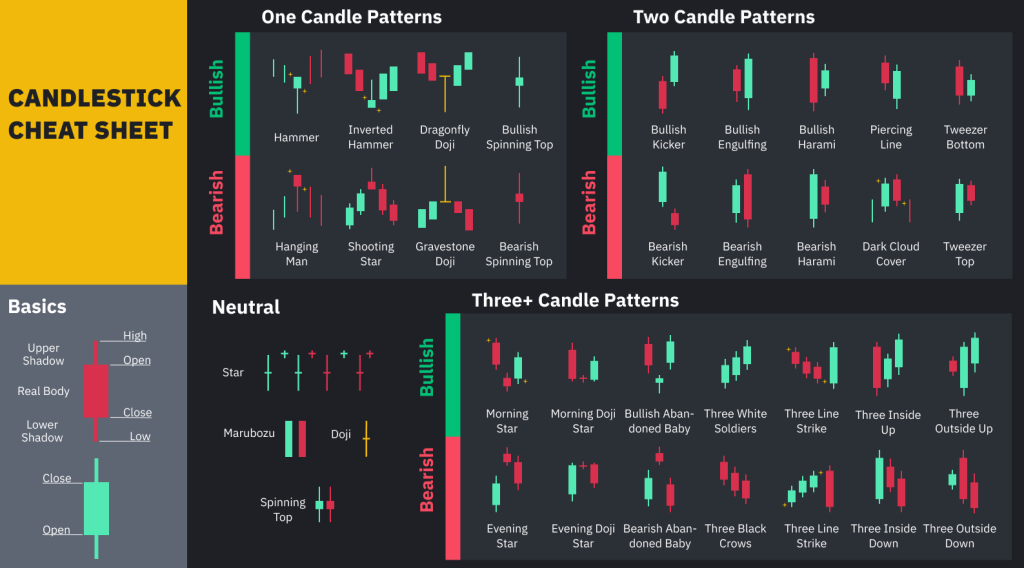
Candlestick Chart Patterns
Candlestick chart patterns are the building blocks of technical analysis, offering a snapshot of an asset’s price action over time. Each candlestick represents a specific period, with green candles signaling price increases and red candles indicating declines. By analyzing these patterns, traders can gain valuable insights into market sentiment and potential price movements.
One of the beauties of candlestick charts is their versatility – you can adjust the time period to suit your trading style. Whether you’re a day trader or a long-term investor, there’s a timeframe for you. Choose from monthly, weekly, daily, or even one-minute charts to get a closer look at price action.
Reading the Volume
Volume is like the heartbeat of the market, providing clues about the strength of price movements. Volume data tend to be placed on the bottom of the chart. Green bars signify buying pressure, while red bars indicate selling pressure. High volume paired with price increases suggests bullish momentum, while low volume may signal a lack of conviction.
Drawing the Lines
Trend lines are the roadmaps of technical analysis, guiding traders through market trends and price movements. By connecting relevant data points, trend lines help identify support and resistance levels – key areas where price tends to bounce or reverse.
Support and Resistance Levels
Support and resistance levels are like the guardrails of the market, defining boundaries that price struggles to breach. Support price/line acts as a floor, preventing price from falling further, while resistance price/line acts as a ceiling, capping upward movements. These levels reflect areas of increased trading activity and market interest.
Moving Averages: Seeing the Big Picture
Moving averages offer a broader perspective on market trends by smoothing out price fluctuations over longer timeframes. Whether it’s the simple moving average (SMA) or the exponential moving average (EMA), these indicators help traders identify trends and potential reversal points. Moving averages are more of a long term indicators.
The Power of RSI
The relative strength index (RSI) is one of the most crucial parts of the analysis. It is offering insights into overbought and oversold conditions. By measuring the magnitude of recent price changes, the RSI helps traders gauge market momentum and identify potential buying or selling opportunities.
Many other
There are many other indicators. We simply want to show you the basic ones which are universally used in every market, be it Crypto or Stock market. By mastering them, you will be able to diversify your attention into multiple venues.

One Comment
Comments are closed.